
Week 18’s #WorkoutWednesday challenge has a lot of potential in varying applications. The challenge was to show/hide visualizations based on a set of navigation icons. This gives the user the appearance of activating vizzes by clicking the related icon, but without loading a new dashboard.

The not loading the new dashboard was the new bit for me here. I’d sought out and used this technique to navigate between dashboards/sheets, but never to switch the viz on the current dashboard. I appreciate the thought behind this concept.
To achieve this, you’ll need to do a couple of things (once you have you viz sheets built, of course):
- find your icons and add to custom shapes
- create a linking field
- set up your dashboard
- set up the dashboard actions
1) finding icons / custom shapes
Where you find your icons is up to you. Once you’ve got them, place them (..\My Tableau Repository\Shapes\Custom Shapes). From there, assign the shape. I created fields [‘iconCategory’, ‘iconState’, ‘iconTime’] with ‘iconTime’ previewed below:
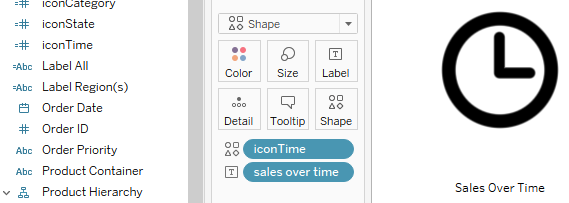
2) these “icon” fields not only serve to provide the image, they begin the linking as well. inside of each field, I simply placed “1” (no quotes). You’ll need to then place these “icon” fields in the detail portion of their respective paired sheets (ie iconTime with salesOverTime).
3) place your sales sheets on the dashboard, as floating sheets – one directly over the previous. (You’ll want to make sure your backgrounds are transparent, not white!)
4) finally, the dashboard actions. the source is the “icon” sheet, the target the respective sales sheet. you’ll want to set “Clearing the selection will: Exclude all values”. This will set the dashboard back to it’s original state.
there you have it!
Hide yo kids, hide yo charts (likely an American-only reference, sorry!):