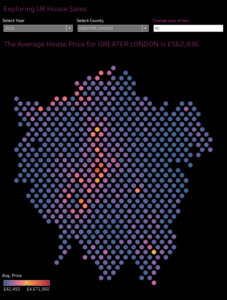
Week 10. Another week’s challenge, and another oh so close reconstruction of the visualization. Here, I set a personal best to re-creating the entire dashboard; except it took me over an hour to get the ‘size of hex’ parameter to work.

Week 10. Another week’s challenge, and another oh so close reconstruction of the visualization. Here, I set a personal best to re-creating the entire dashboard; except it took me over an hour to get the ‘size of hex’ parameter to work.
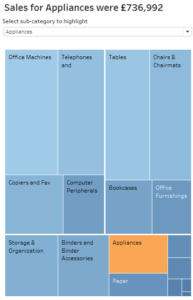
Another week (working backward) and another #WorkoutWednesday I was sure I’d solve. The challenge for week 12 was to allow for a highlight within a treemap. Initially didn’t seem all that practical, but seeing the power of this – with the user able to select/highlight within the treemap – I may end up using this one.
Another week, another confident beginning…
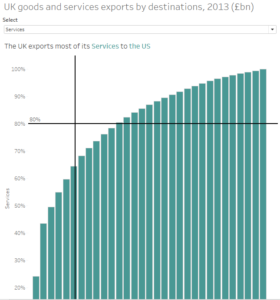
Week 14‘s challenge was to create a Pareto chart, and use this to determine whether or not UK exports hold to the Parerto Principle. I like the simplicity of the outcome of this one, and I’ve some thoughts on where I’ll employ similar concepts.
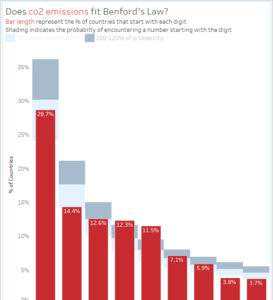
My third #WorkoutWednesday ever, yet the 13th of 2017, gave me such excitement at first glance – I was sure I could nail this one in an hour’s time. The author’s comment “[t]his shouldn’t be too terribly challenging” boosted the confidence. It still knocked me around a bit.
The full details of the challenge are at vizwiz.com, the short of Benford’s law is that the distribution of the first digits of real-world numbers are not evenly distributed. Meaning, the numbers 1-9 are not represented equally as the leading digit in a number. Reading it, processing it, it was a quick “well, of course!” Identification numbers, account numbers, etc – you start with 1 and count up!